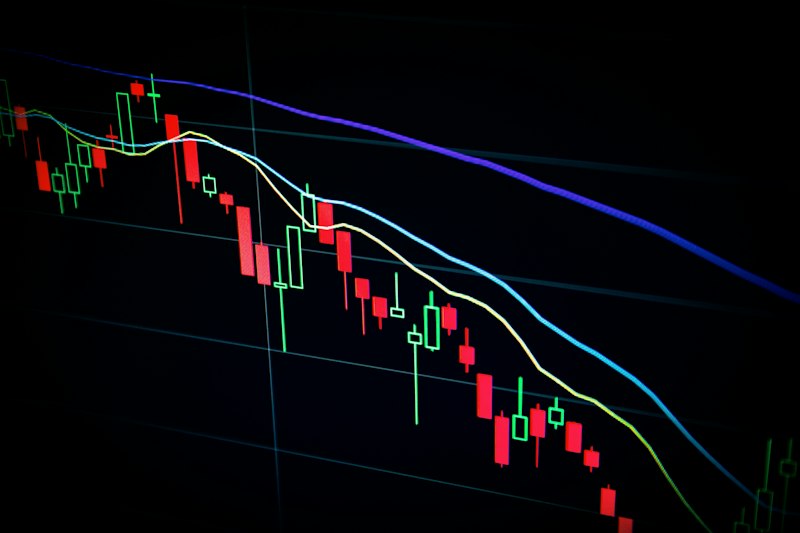
The EUR/USD pair remains the most traded currency pair in the world, accounting for roughly 23% of daily forex volume. As we move through March 2026, several macro factors are converging that could drive significant price action. This analysis covers the fundamental backdrop, technical levels, and potential trading scenarios for the month ahead.
Important: This is analysis, not a trade recommendation. Always do your own research and manage your risk accordingly.
Fundamental Backdrop: What Is Driving EUR/USD?
The Federal Reserve Stance
The Fed entered 2026 in a cautious holding pattern after cutting rates twice in late 2025. Key factors for March:
- **Interest rates** remain at 4.00–4.25% after the January pause
- **Inflation** (CPI) has settled around 2.4%, still slightly above the 2% target
- **Labor market** shows signs of gradual cooling — unemployment at 4.2%
- **Fed minutes** from the January meeting signaled a data-dependent approach with no urgency to cut further
- **Market expectations** price in one more 25bp cut by mid-2026
The dollar has found support from the rate differential, as US yields remain significantly higher than eurozone equivalents.
The European Central Bank
The ECB has been more aggressive in easing, cutting rates three times since September 2025:
- **Main refinancing rate** at 2.65%, down from 3.65% in mid-2025
- **Eurozone inflation** at 2.1%, closer to target than the US
- **Growth** remains sluggish — Q4 2025 GDP came in at 0.3% annualized
- **German manufacturing** continues to struggle, weighing on the broader eurozone
- **ECB rhetoric** suggests at least one more cut is likely in Q2 2026
The widening rate differential (US minus EU) has been a headwind for EUR/USD.
Geopolitical and Trade Factors
- **US trade policy** — renewed tariff discussions on European goods could pressure the euro
- **Energy prices** — natural gas prices have stabilized, removing one source of euro weakness
- **Ukraine conflict** — ongoing but largely priced in; any ceasefire developments would be euro-positive
- **Chinese demand** — a weaker Chinese economy reduces demand for European exports
Technical Analysis: Key Levels to Watch
Monthly Chart Overview
EUR/USD has been trading in a broad range between 1.0350 and 1.0850 since late 2025. The pair failed to break above the 200-day moving average in January and has since drifted lower.
Key Support Levels
| Level | Significance | |-------|-------------| | 1.0520 | Current support zone, aligns with 50-day MA | | 1.0450 | Previous swing low (February 2026) | | 1.0350 | Major support — bottom of the 4-month range | | 1.0280 | 2025 low, last tested in October | | 1.0200 | Psychological level and multi-year support |
Key Resistance Levels
| Level | Significance | |-------|-------------| | 1.0620 | 200-day moving average (dynamic resistance) | | 1.0700 | Previous swing high, round number | | 1.0770 | January 2026 high | | 1.0850 | Top of the 4-month range | | 1.0950 | Fibonacci 61.8% retracement of the 2025 decline |
Moving Averages
- **50-day MA:** ~1.0520 (currently acting as support)
- **100-day MA:** ~1.0580 (converging with price — watch for a breakout)
- **200-day MA:** ~1.0620 (key resistance; a daily close above would be bullish)
RSI and Momentum
- **Daily RSI:** Near 45 — neutral territory, no overbought or oversold signal
- **Weekly RSI:** 42 — slightly bearish bias but not extreme
- **MACD:** Bearish crossover on the daily chart as of late February
Three Scenarios for March 2026
Scenario 1: Range Continuation (Most Likely — 50% probability)
EUR/USD remains within the 1.0450–1.0700 range as markets await clearer direction from the Fed and ECB.
Triggers: Mixed US data, no surprise ECB actions, low volatility Trading approach: Buy near 1.0450 support, sell near 1.0700 resistance with tight stops beyond each level
Scenario 2: Bearish Break Below 1.0450 (30% probability)
A hot US inflation print or hawkish Fed commentary pushes the dollar higher, breaking EUR/USD below the range.
Free: US Forex Trading Checklist
Don't start trading without this 20+ item checklist. Covers broker verification, account setup, and compliance essentials.
Triggers: CPI above expectations, strong US jobs data, escalation in trade tensions Key target: 1.0350 (range bottom), then 1.0280 Trading approach: Sell on a confirmed daily close below 1.0450, target 1.0350 with a stop above 1.0520
Scenario 3: Bullish Break Above 1.0700 (20% probability)
A dovish Fed surprise or positive eurozone growth data lifts the euro above the 200-day MA.
Triggers: Weak US data sparking rate cut expectations, ECB pause, geopolitical de-escalation Key target: 1.0770, then 1.0850 Trading approach: Buy on a confirmed daily close above 1.0620 (200-day MA), target 1.0770
Key Economic Events in March 2026
Mark these dates on your calendar — each one could trigger significant EUR/USD moves:
Week 1 (March 2–6)
- **March 3:** Eurozone Manufacturing PMI (final)
- **March 5:** US ADP Employment Report
- **March 6:** ECB Interest Rate Decision
Week 2 (March 9–13)
- **March 10:** Eurozone GDP (revised)
- **March 11:** US CPI Report (critical for Fed outlook)
- **March 13:** US PPI and University of Michigan Sentiment
Week 3 (March 16–20)
- **March 18–19:** FOMC Meeting and Interest Rate Decision
- **March 19:** Fed Chair Press Conference and Dot Plot
- **March 20:** Eurozone Consumer Confidence
Week 4 (March 23–27)
- **March 24:** Flash PMIs (Eurozone and US)
- **March 26:** US Q4 GDP (final revision)
- **March 27:** US Core PCE Price Index (Fed's preferred inflation gauge)
The two biggest events are the US CPI on March 11 and the FOMC decision on March 18–19. These two releases alone could define the month's trend.
Positioning and Sentiment
COT Report (Commitment of Traders)
As of the latest data, large speculators hold a net short EUR position of approximately 45,000 contracts — the largest short position since Q3 2025. This is notable because extreme positioning often precedes reversals. If EUR/USD stabilizes, a short-covering rally could push prices higher.
Retail Sentiment
Retail traders are currently 65% long EUR/USD according to major broker positioning data. This is a contrarian bearish signal, as retail traders tend to be wrong at extremes. However, the 65% level is not extreme enough to be a high-confidence signal on its own.
How to Trade EUR/USD This Month
For Range Traders
- Identify the range boundaries (1.0450–1.0700)
- Buy at support, sell at resistance
- Use stop losses 30–50 pips beyond each level
- Take partial profits in the middle of the range
For Breakout Traders
- Wait for a daily close outside the range (not just a wick)
- Confirm with volume and momentum indicators
- Target the next key level (1.0350 or 1.0770)
- Use the broken level as your new support/resistance
Risk Management
- Risk no more than 1–2% of your account per trade
- EUR/USD can move 100+ pips on major data releases — size accordingly
- Consider reducing position size ahead of CPI and FOMC
- [Read our risk management guide](/blog/forex-risk-management-guide/) for detailed position sizing strategies
Where to Trade EUR/USD
For reliable EUR/USD execution, consider these regulated options:
- **[OANDA](/review/oanda/)** — Tight EUR/USD spreads, excellent charting
- **[Forex.com](/review/forexcom/)** — Competitive pricing, strong execution
- **[IG](/review/ig/)** — Wide instrument range, professional tools
Compare brokers to find the best fit for your trading style.
Bottom Line
March 2026 is shaping up as a pivotal month for EUR/USD. The ECB decision in early March and the FOMC meeting mid-month will set the tone. Our base case is that the pair stays range-bound between 1.0450 and 1.0700, but the risk of a downside break is higher than an upside one given the fundamental backdrop.
Stay nimble, watch the key levels, and let the data drive your decisions.
---
*Disclaimer: This article is for educational purposes only and does not constitute financial advice or a trade recommendation. Forex trading involves substantial risk of loss and is not suitable for all investors. Past performance does not guarantee future results. Always conduct your own analysis before entering any trade.*
Compare Brokers Mentioned in This Article
| Broker | Rating | Spreads | Leverage | Min Deposit | Action |
|---|---|---|---|---|---|
| 3.7 | 0.7 pips | 1:50 | $0 | Visit Broker | |
| 3.5 | 0.2 pips | 1:50 | $100 | Visit Broker | |
| 3.6 | 0.6 pips | 1:50 | $250 | Visit Broker |



Risk Warning: Trading forex/CFDs carries high risk. 74-89% of retail accounts lose money.
The Complete US Forex Trading Checklist
Everything you need to verify before depositing your first dollar. Covers broker selection, CFTC compliance, account setup, and risk management.